Trading technical analysis

Moving average trading strategy
Moving averages are one of the most widely used technical indicators. Discover how to use the different types and strategies to identify trends, support and resistance, and more.
What is a moving average trading strategy?
A moving average trading strategy is a widely used technical analysis method that uses the moving average (MA) of a security's price to identify potential market trends. The moving average calculates the average price of a security over a specified period. By smoothing out short-term price fluctuations, it can help traders discern the underlying trend and gauge overall market sentiment, as well as spot potential support and resistance, and entry and exit signals.
Highlights
- A moving average smooths price data to show the underlying trend.
- Traders can use moving averages in different ways, such as choosing the right time frame, identifying a trend, and determining support and resistance.
- The most common types are the simple (SMA), exponential (EMA) and weighted (WMA) moving averages.
- The key moving average trading strategies are crossover, envelope and ribbon.
- Moving averages are lagging indicators, so they're best combined with other tools.
Moving average explained
The moving average is a versatile and easily customisable technical indicator, allowing traders to choose from various types and timeframes to design a personalised strategy. It is calculated by adding the closing prices for a number of periods and dividing the total by that number. As each new period closes, the oldest price drops out, so the average "moves" along the chart.
In the 1920s and 1930s, moving averages gained prominence as a popular trading tool, thanks in part to the work of Richard Schabacker and Robert Rhea, who introduced the concept of trend following. The idea behind this approach is that traders can capitalise on sustained price movements by identifying and following trends using moving averages.
How to trade with a moving average
Below are some ways to use the moving average indicator to enhance your trading.
Choosing the right time frame
The moving average is available on most trading platforms and appears as a line that follows the price chart. In the chart below, for example, moving averages are drawn as lines following the candles.
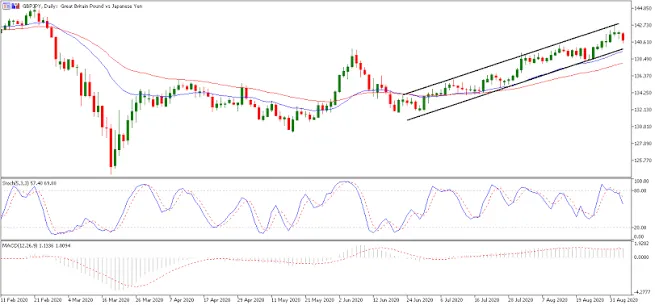
Traders can choose between multiple time frames, also known as "look-back" periods, ranging from a few hours to several months. Short-term moving averages (such as 10 or 20 periods) react quickly to price changes and suit active traders, while longer averages (such as 50, 100 or 200 periods) are slower but give a smoother indication of the broader trend.
Identifying a trend
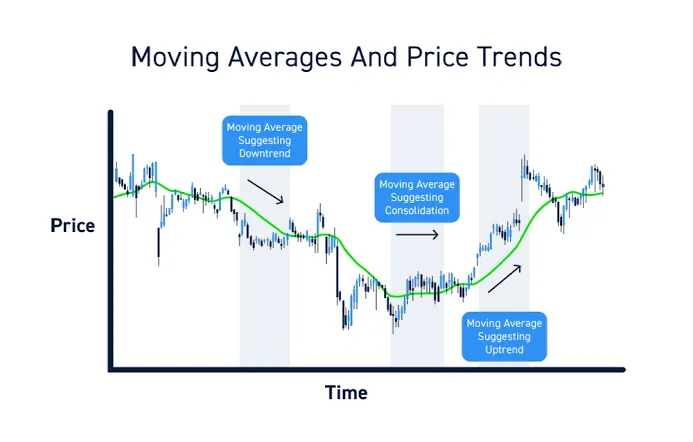
As their original use suggests, moving averages are widely used to identify price trends. When the price moves – and trades consistently – above a rising moving average, it is considered to signal a potential uptrend, while a price below a falling moving average may indicate a downtrend. The slope of the moving average can also provide information about the momentum of the trend.
Determining support and resistance
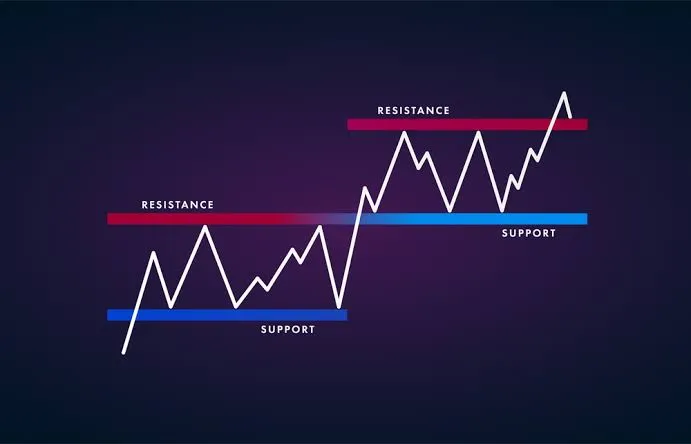
Moving averages can also act as dynamic support and resistance levels. In an uptrend, the moving average may act as a support level, where prices tend to bounce off it and continue upwards. Conversely, in a downtrend, it can serve as a resistance level, where rallies tend to stall and prices resume their downward path. Traders watch how price reacts when it touches widely followed averages such as the 50-day or 200-day.
This feature of moving averages can help traders identify entry and exit points and set stop-loss and take-profit orders. Note that ordinary stop-losses do not protect from slippage. A guaranteed stop-loss may be used, but it comes at a fee.
Using different types of moving averages
Over the years, various types of moving averages have been developed to suit different trading styles and objectives. For instance, the simple moving average (SMA) was followed by the introduction of the exponential moving average (EMA) by J. Welles Wilder Jr. in the 1970s, which gives more weight to recent price data, making it more responsive to current market conditions. In addition, the weighted moving average (WMA) was developed to further emphasise specific periods in the calculation.
How to calculate a moving average
Depending on the type, there is a different moving average formula.
Simple moving average (SMA)
The SMA is the most basic and widely used type of moving average. It is calculated by taking the arithmetic mean of a given set of prices or data points over a specified period:
SMA = (P1 + P2 + … + Pn) / n, where P1, P2, … , Pn are the prices of the data points (usually closing prices) and n is the number of periods.
The SMA gives equal weight to each price point and smooths out price fluctuations to reveal the underlying trend. However, it can be slow to react to recent price changes, making it less responsive to sudden market movements.
Exponential moving average (EMA)
The EMA is a more advanced type of moving average that gives more weight to recent price data, making it more responsive to new market information:
EMA = (Close − Previous EMA) × (2 / (n + 1)) + Previous EMA, where Close is the current closing price, Previous EMA is the previous period's EMA value and n is the number of periods. The term 2 / (n + 1) is called the multiplier.
The EMA reacts more quickly to recent price changes, giving traders a faster signal for potential trend reversals or continuations. However, the increased sensitivity may also lead to more false signals than the SMA.
Weighted moving average (WMA)
The WMA assigns different weights to each price point. Like the EMA, it typically places more importance on recent data, but the two differ in the way they calculate the average and assign weights:
WMA = (P1 × n + P2 × (n − 1) + … + Pn × 1) / (n × (n + 1) / 2), where P1 is the most recent price, Pn the oldest and n the number of periods.
Unlike the SMA, which gives all data points equal weight, and the EMA, which uses exponential smoothing, the WMA multiplies each price by a weight factor that decreases as the data gets older. This gives the WMA a quicker response to price changes than the SMA and a more customisable weighting system than the EMA – but, like the EMA, its increased sensitivity can result in more false signals.
Moving average crossover strategy
The moving average crossover strategy is based on the principle that when two moving averages of different periods cross each other, it indicates a potential change in the market trend.
A crossover occurs when a short-term moving average crosses a long-term one. The short-term average is more sensitive to recent price changes, whereas the long-term average gives a smoother representation of the price trend. When they intersect, it can signal a shift in market sentiment, indicating that the trend might be reversing or accelerating. There are two primary types of crossover:
Bullish crossover
A bullish crossover occurs when the short-term moving average crosses above the long-term moving average – for example, the "golden cross", when the 50-period crosses above the 200-period. It signifies that recent price momentum is stronger than the historical trend, which may indicate that the market is entering a bullish phase.
Traders typically interpret a bullish crossover as a buy signal, suggesting they may enter a long position or add to an existing one. Bullish crossovers can occur with simple, exponential or weighted moving averages, depending on the trader's preference and strategy.
Bearish crossover
A bearish crossover happens when the short-term moving average crosses below the long-term moving average – for example, the "death cross", when the 50-period crosses below the 200-period. In this scenario, recent price momentum is weaker than the historical trend, possibly indicating a bearish market phase.
Traders generally interpret a bearish crossover as a sell signal, suggesting they may exit a long position, enter a short position or reduce their exposure to the market. Like bullish crossovers, bearish crossovers can involve any type of moving average.
Moving average envelope strategy
The moving average envelope strategy consists of three components: a central moving average line, typically a simple moving average (SMA), and two parallel lines, or "envelopes", placed above and below it at a fixed percentage distance. Traders use them to identify overextended price moves and potential reversals within a trend.
This strategy is similar to the Bollinger Bands® indicator. Bollinger Bands place bands two standard deviations above and below a 20-period SMA, so their distance is based on price volatility; prices near the upper band may indicate overbought conditions and near the lower band oversold conditions, while narrowing bands can signal an upcoming breakout. The percentage distance of envelopes, by contrast, can be adjusted depending on both volatility and the trader's risk tolerance.
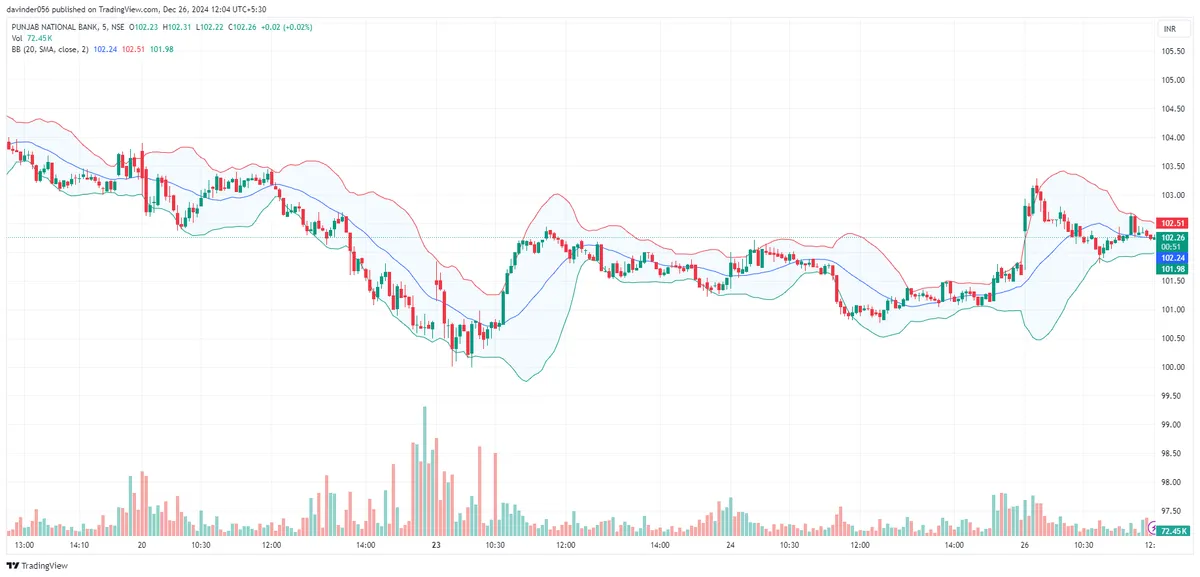
To determine the optimal percentage distance, traders can observe historical price movements to identify the asset's typical fluctuations, or take a trial-and-error approach, testing various distances.
In practice, moving average envelopes may serve as dynamic support and resistance levels, guiding traders in determining their positions. When the price moves towards or breaches the upper envelope, it may indicate overbought conditions. Conversely, if the price approaches or breaks below the lower envelope, it could signal oversold conditions.
Moving average ribbon strategy
The moving average ribbon strategy uses multiple moving averages to analyse price trends. The ribbon consists of a series of moving averages with varying timeframes, typically from short-term to long-term, providing a comprehensive visual representation of the underlying trend's strength and direction.
To implement it, traders plot a sequence of moving averages, such as SMAs or EMAs, on a price chart. The choice of timeframes depends on the trader's preferences and market conditions. Commonly used periods include 10, 20, 30, 50 and 100 days, although customisation may suit individual strategies better.
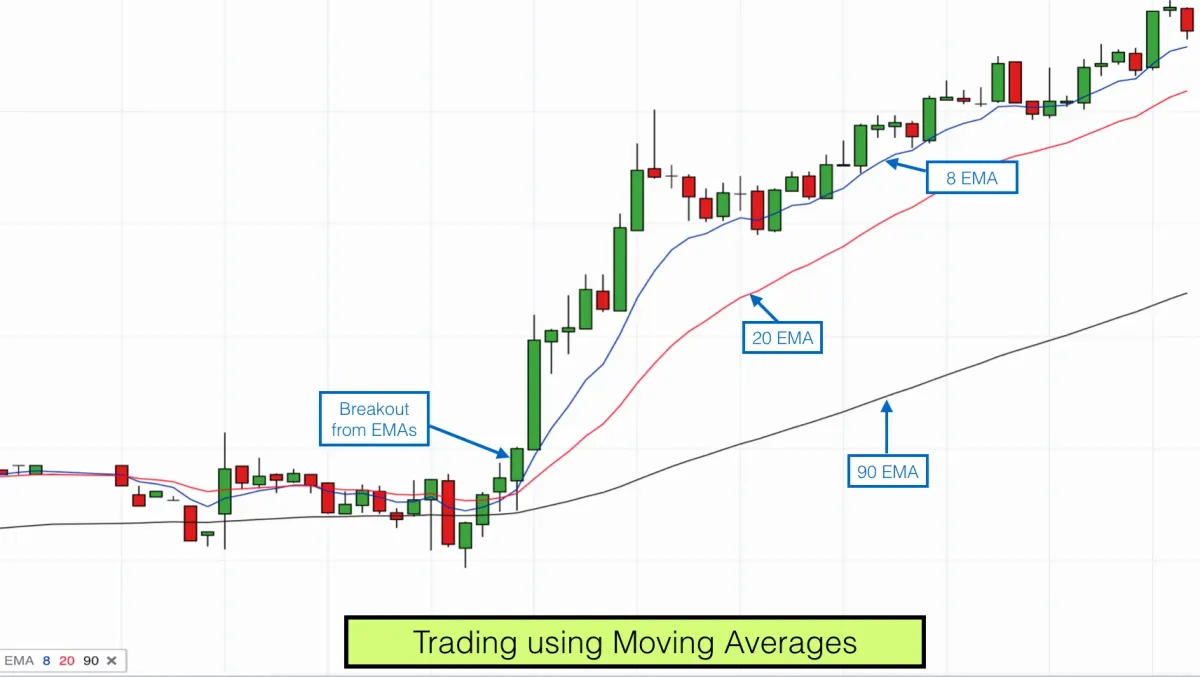
The key concept is to observe the alignment and spacing of the moving averages. When they are aligned in ascending order (shortest to longest) and evenly spaced, it may suggest a strong uptrend. If they are arranged in descending order (longest to shortest) and evenly spaced, a strong downtrend is indicated. Trading signals are generated when the moving averages converge, diverge or show a notable change in spacing, as these events may signal potential trend reversals or continuations.
Combining moving averages with other indicators
Combining moving averages with momentum indicators and volume can help confirm signals and filter out false ones in choppy markets.
Conclusion
The moving average trading strategy is a popular technical analysis method used to identify potential market trends. By smoothing out price fluctuations, the moving average helps traders discern underlying trends and gauge overall market sentiment.
Traders can customise their strategies by choosing the appropriate time frame and type of moving average, such as the SMA, EMA or WMA. Moving averages can also act as dynamic support and resistance levels and help identify entry and exit points. The key techniques are the crossover, envelope and ribbon strategies.
Moving averages are versatile tools, but because they lag price, they work best in trending markets and when used alongside other forms of analysis. As with any trading strategy, it's essential to perform thorough analysis, use risk-management techniques and continuously monitor the market to adjust your approach as needed. You may also choose to test your strategy on a demo account before risking real money.
What is the exponential moving average (EMA)?
Think of asset prices as a fast-moving, winding river. A simple average of the price is like a slow-moving raft: it tells you the general direction of the flow, but it moves too slowly to show the immediate turns. The exponential moving average (EMA) is more like a speedboat – it stays closer to the surface and reacts much faster to every small bend and change in the current. This speed helps traders see trends and changes quickly, which is why the EMA trading strategy is so popular.
Understanding the exponential moving average (EMA)
The EMA is a line on a price chart that smooths out price data, helping you see the trend more clearly. Like any moving average, it calculates the average price of an asset over a specific period – but it uses a weighting method that places greater weight on the most recent prices, so it reacts to new information very quickly.
This is the main difference between the EMA and the SMA. The simple moving average treats all prices in a period equally: a 10-day SMA gives the first day's price and the tenth day's price the same importance. The EMA gives recent prices more importance, making it a "faster" line that follows the price more closely – a big advantage for active traders, who often use it for shorter-term strategies and to spot trend changes earlier.
Real-world relevance and usage
The EMA is one of the most popular indicators. Traders use it for three main things: to spot trends (if the price is above the EMA, it is an uptrend), to find support and resistance levels (the EMA line often acts as a price floor or ceiling), and to identify entry and exit points, as the indicator gives clear signals for when to buy or sell.
EMA formula and how to calculate it
The EMA calculation is more complex than the SMA. Fortunately, you don't need to calculate it yourself – your trading platform does it for you and places the line on your price chart. However, understanding the formula helps you understand how the indicator works:
EMA = (Closing price − Previous EMA) × Multiplier + Previous EMA
- Closing price is the last traded price of the period – on a daily chart, for example, the close of the day's candlestick.
- Previous EMA is the EMA value for the prior period. For the very first calculation, the SMA is used as the initial EMA value.
- Multiplier is the smoothing constant, determined by the number of periods you use (N).
Smoothing factor: the most important part of the formula
The multiplier is often represented as α (alpha) and ensures that more weight is given to recent prices. To calculate it:
- Choose the EMA length (N), such as a 10-day or 50-day EMA.
- Use the formula α = 2 / (N + 1).
- Understand the result: alpha is the share of the new EMA that comes from the latest closing price; the rest comes from the previous EMA value.
For example, for a 10-day EMA, N = 10, so α = 2 / (10 + 1) = 2 / 11 = 0.1818. This means about 18% of the new EMA's value comes from the closing price.
Shorter EMA periods have a larger α and react much faster, while longer EMA periods have a smaller α – they react more slowly and are smoother.
EMA vs exponentially weighted moving average (EWMA)
The two terms are used interchangeably: they both refer to the same calculation, which gives more weight to recent data points.
How to use the EMA in trading
The EMA is a flexible tool that can be used in many ways. Here's what you need to know.
Spotting trends with the EMA
The EMA is a popular indicator for trend trading, as it clearly shows the market's direction. During an uptrend, the price consistently stays above the EMA line while the line itself keeps rising. In a downtrend, the price remains below a falling EMA line. In sideways markets, the price crosses the EMA line frequently, while the line stays flat.
Entry and exit timing using the EMA
Traders use the EMA to time their trades. When the price crosses above a rising EMA – or drops to a rising EMA line and bounces up – it is seen as a buy signal. When the price crosses below a falling EMA – or rises to a falling EMA and is rejected – it is taken as a sell signal.
Common EMA periods
Choose EMA periods based on your trading strategy. Each period has a different purpose.
| EMA period | Common use | Context |
|---|---|---|
| 9 or 10 | Very short-term momentum / quick trend | Fast signals for scalping, day trading or aggressive trading. |
| 12 / 26 | MACD calculation | The MACD is built from these two EMAs; short to medium-term. |
| 20 or 21 | Short-term trend | Used for the main trading period and volatility measurement; day and swing trading. |
| 50 | Medium-term trend | Popular among swing traders and for moderate trend strength. |
| 100 | Long-term trend | Important for position traders and significant support/resistance. |
| 200 | Major long-term trend | The most important line: it defines the major market cycle; position trading. |
Choosing the right EMA for your strategy
Your trading style determines your choice. Shorter EMAs give more signals but also more false signals; longer EMAs are more reliable for trend identification but slower to react.
- Day traders/scalpers: use shorter EMAs (9 or 20) for fast signals on short timeframes, such as 5-minute charts.
- Swing traders: use medium-term EMAs (50 or 100) for less noise on daily or 4-hour charts.
- Position traders: use long-term EMAs (200) to see the big-picture trend.
EMA trading strategies
Different strategies use the EMA in different ways. Consider combining the EMA with other technical indicators to confirm signals. Remember that these strategies do not guarantee profits, and past performance does not guarantee future results.
EMA crossover strategy
The EMA crossover is the most popular strategy. It uses a fast EMA and a slow one:
- Golden cross (buy signal): the faster EMA crosses above the slower EMA, suggesting a major uptrend is starting.
- Death cross (sell signal): the faster EMA crosses below the slower EMA, signalling the start of a major downtrend.
Shorter periods, such as the 9-EMA and 21-EMA, are used for faster signals. This is common in an aggressive EMA trading strategy.
EMA 1-minute scalping strategy
- Apply a fast EMA (e.g. 9) and a slower EMA (e.g. 21) to a one-minute chart.
- Enter long when the fast EMA crosses above the slow EMA and price is above both.
- Enter short when the fast EMA crosses below the slow EMA and price is below both.
- Use tight stop-losses and predefined profit targets.
EMA + RSI confirmation strategy
Use the EMA to identify the trend and the RSI to confirm the momentum:
- Trend check: use the 50-EMA to identify the trend. Look to buy only when the price is above the 50-EMA.
- Momentum check: wait for the price to pull back towards the 50-EMA.
- Confirmation: enter the trade when the RSI dips (without becoming oversold) and then starts moving up. This suggests the selling pressure is ending and momentum is returning to the uptrend.
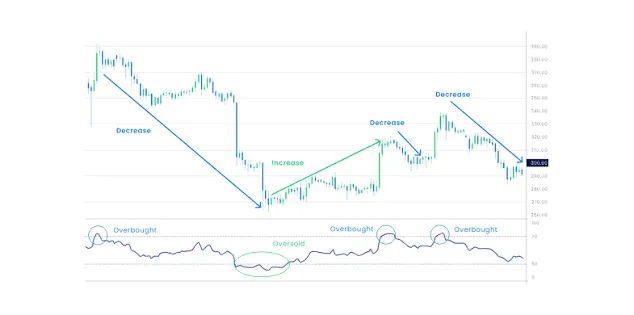
The EMA as dynamic support and resistance
The EMA line rarely stays flat. It moves with the market, which is why it is called a dynamic level. During an uptrend, a rising EMA (such as the 20-EMA) acts as dynamic support, and traders buy when the price pulls back to it. In a downtrend, a falling EMA acts as dynamic resistance, and traders sell when the price rallies to it.
Trend-following strategy using the 200-EMA
The 200-day EMA is the most respected moving average, showing the long-term health of an asset. The golden rule of this trend-following strategy is to open long trades only when the price is above the 200-EMA, and short trades only when it is below. This helps a trader stay on the right side of the major trend and avoid buying into a long-term decline.
Combining the EMA with other indicators
The EMA works best when used with other indicators to confirm signals and avoid false ones.
EMA + MACD
The moving average convergence divergence (MACD) is built from EMAs and measures the distance between two of them. You can use the EMA to find the trend direction and the MACD to time your entry. For example, if the 50-EMA is trending up, only enter a long trade when the MACD crosses above its signal line.
EMA + RSI
As described above, the EMA shows the direction, while the RSI shows momentum and overbought/oversold conditions.
EMA + volume or price action
When the price bounces off the 200-EMA on high volume, it is considered a very strong signal, as high volume confirms strong institutional interest at that level. For price action, look for candlestick patterns at the EMA: a hammer or a bullish engulfing pattern at the 20-EMA support line is regarded as a high-probability entry signal.
Advanced EMA concepts and variants
Experienced traders can try more complex EMA variants that aim to reduce lag even further.
Double EMA (DEMA)
The DEMA attempts to remove the inherent delay (lag) of a standard EMA by combining a single and a double-smoothed EMA in its formula. It is a much faster-acting line than the standard EMA.
Triple EMA (TEMA)
The TEMA is an even more aggressive variant that uses three EMAs to reduce lag further. It follows the price very closely and suits fast-moving markets, but it can be noisy.
EMA with volatility filters
In a choppy market, the EMA can give many false signals (whipsaws). A volatility filter helps: traders often use the average true range (ATR) to filter EMA signals, so the system only opens trades when the market is clearly moving.
Anchored EMA
The anchored EMA (AEMA) starts its calculation from a significant date or price event, such as a market crash or a major earnings report. It acts as a fixed, long-term benchmark.
Where and when to use these variants
The DEMA and TEMA are popular for short-term strategies, such as scalping, on low timeframes, as they react very fast. The anchored EMA is used for long-term analysis, showing the average price paid since a major event.
The EMA in different markets
The EMA works on almost every type of market, although its settings might need slight adjustments.
Forex trading
The EMA is extremely popular in forex trading, as currency markets trade 24 hours a day. The 20-EMA on the 1-hour or 4-hour chart is popular, and the 9-EMA and 21-EMA crossover is a standard strategy.
Stock trading
The 50-day and 200-day EMAs are the most commonly used in stock trading, and institutions watch these lines closely. A move below the 200-day EMA is often a major bearish sign for a stock.
Cryptocurrencies
Crypto markets are highly volatile, which makes a traditional SMA too slow. The fast-reacting EMA is better suited here, and shorter EMAs such as the 9, 12 and 26-period are common on lower timeframes.
Commodities
Commodities tend to trend strongly, and the 50-EMA is useful for riding these trends, acting as dynamic support during strong bull runs in gold or oil.
Market-specific behaviour and timeframes
The main rule is to adjust the period to your timeframe. The 20-period EMA on a daily chart is a 20-day average, while the 20-period EMA on a 5-minute chart covers only 100 minutes (20 × 5).
Strengths and limitations of the EMA
No indicator is perfect, so it's important to know the pros and cons. The EMA reacts faster to price changes, which reduces lag and gives traders earlier signals than the SMA. It is well suited to trend-following strategies, as its speed allows traders to catch trends early and ride them for longer, and it works on all timeframes – from 1-minute charts to monthly charts.
However, the EMA is prone to whipsaws in choppy markets: its fast reaction causes many false signals when the price is moving sideways, and it may give false signals without confirmation. This is why it is best to confirm its signals with other indicators, such as the RSI or volume.
Real-world applications
History shows the power of key EMA levels.
- During the 2008 financial crisis, the S&P 500 decisively broke below its 200-week EMA. This confirmed that the long-term bull market was over and marked the start of a deep recessionary bear market.
- During major bitcoin bull runs, the BTC price rarely closed below the 21-week EMA, which acted as critical dynamic support. Traders who bought each time the price touched this line often saw strong returns – but past performance is not a guarantee of future results.
- The 50-day and 200-day EMAs are often self-fulfilling. Because so many traders watch them, a touch of the 200-EMA often triggers a surge of buying or selling.
Practical tips for using the EMA efficiently
Using the EMA effectively is all about proper setup and discipline.
- Platform settings: popular platforms such as TradingView and MT4 let you change the EMA period. Use the "Close" price for the calculation, and make sure to select "Exponential" rather than "Simple" when adding the indicator.
- Optimising EMA periods: don't simply use the default settings. Test different periods (10, 21, 55, 100) on the asset you trade and find the EMA it respects most often – this is called optimisation.
- Avoiding lag with faster EMAs: use faster EMAs (such as 9 or 12) as an early warning, and a slower EMA (such as 50) to confirm the main trend.
- Alert-based trading rules: set up alerts on your platform so you don't need to watch the chart constantly – for example, "alert me when the 9-EMA crosses the 21-EMA on the 4-hour chart". This ensures you only trade when your EMA strategy is triggered.
What is the Hull moving average?
The Hull moving average (HMA) is a technical analysis tool that measures the average price of an asset over a period of time. In contrast to traditional moving averages (MA), it aims to reduce lag while minimising noise and keeping the line smooth. Here, we look at the indicator's mechanics and how to design your own Hull moving average strategy.
Highlights
- The HMA responds quickly to price changes while filtering out noise.
- Created by Alan Hull in 2005, it uses a unique calculation that combines the benefits of other moving averages, such as the SMA, WMA and EMA, to create a more responsive and smoother indicator.
- When using the HMA, it's crucial to select parameters and timeframes that suit your trading style and objectives. Alan Hull recommends a default period of 16.
- The HMA can be used to identify trends and turning points, determine support and resistance levels, and combine with other indicators for better trading signals.
- Popular HMA trading strategies include crossover and breakout.
- Like all moving averages, it can produce false signals in ranging markets.
Hull moving average explained
The HMA was created in 2005 by the Australian stock market trader Alan Hull in an attempt to solve the problem of lag in moving averages. As the indicator's creator put it:
"The Hull moving average solves the age-old dilemma of making a moving average more responsive to current price activity whilst maintaining curve smoothness. In fact the HMA almost eliminates lag altogether and manages to improve smoothing at the same time."
The HMA sets itself apart from other moving average types, such as the simple (SMA), weighted (WMA) and exponential (EMA) moving averages, through a calculation that combines the benefits of other moving averages to create a more responsive and smoother indicator.
Hull moving average calculation
Although the HMA is easily accessed on most charting and trading platforms, understanding the mechanism behind it can help you use it more appropriately. To calculate the HMA yourself, follow these steps:
- Choose a number of periods: Alan Hull suggests 16, but traders can use any number suitable for their HMA strategy.
- Calculate two weighted moving averages (WMAs): one for the full number of periods and another for half of it (number of periods / 2).
- Multiply the shorter-period WMA by two and subtract the first WMA: this gives you the raw, non-smoothed HMA.
- Find the square root of the number of periods: you can round it up or down to the nearest whole number.
- Calculate a third WMA of the raw HMA using that number of periods: this is your final Hull moving average.
In short, the Hull moving average formula is: HMA = WMA(2 × WMA(n/2) − WMA(n), sqrt(n)), where WMA is the weighted moving average, n the number of periods and sqrt the square root.
Hull moving average settings for trading
The HMA is calculated using a selected period, which determines its responsiveness and smoothness. Alan Hull recommends a default period of 16, but traders can experiment to find the best fit for their needs. To choose the right time frame, consider your trading style and the type of market analysis you wish to perform. For example:
- Day trading: day traders may prefer shorter time frames, such as 1-minute, 5-minute or 15-minute charts.
- Swing trading: swing traders might opt for 4-hour, daily or even weekly charts.
- Position trading: position traders may focus on weekly or monthly timeframes to identify longer-term trends.
Selecting the right parameters and timeframes is a trial-and-error process, so it's essential to test various settings on historical price data before applying them to live trading.
How to use the Hull moving average in trading
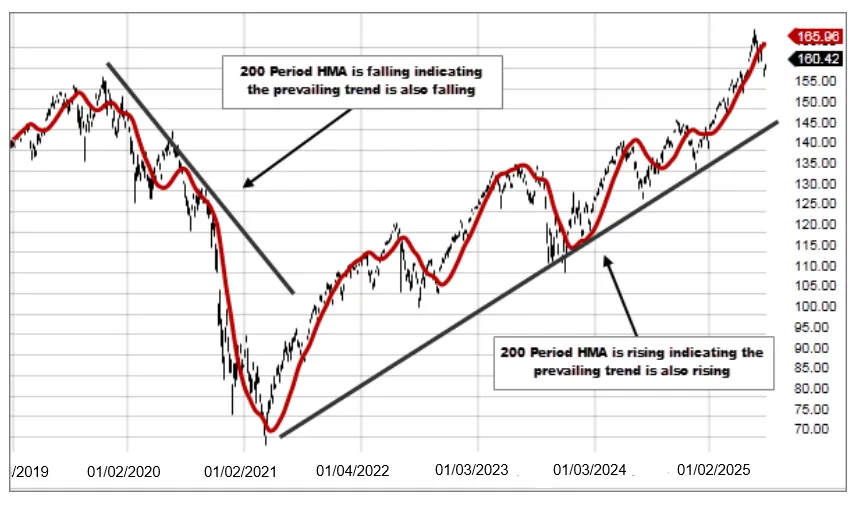
The HMA may be particularly useful for identifying trends, thanks to its smoothness and responsiveness to price changes. To confirm a trend, observe the slope of the HMA line: a rising (upward-sloping) HMA signals a bullish trend, while a falling HMA points to a bearish trend. Traders may enter when the HMA changes direction.
The position of the HMA line relative to the price is informative too. For example, when the HMA is above the price but trending upward, it suggests an uptrend that is likely to face increased resistance. Conversely, when the HMA is below the price but trending downward, it suggests that the downtrend is likely to meet resistance.
Hull moving average crossover strategy
The HMA crossover strategy uses two HMAs of different lengths – a shorter period (e.g. 10) and a longer period (e.g. 50) – and generates signals when they cross. The shorter HMA responds more quickly to price changes, while the longer one gives a smoother picture of the overall trend.
When the shorter HMA crosses above the longer HMA, it signals a potential bullish trend; when it crosses below, it suggests a possible bearish trend.
To improve the accuracy of the strategy, traders can add rules or filters – for example, entering a trade only when the crossover comes with a significant increase in trading volume, which may further confirm the trend's strength. Other technical tools, such as the RSI or MACD, can also help confirm crossover signals.
Hull moving average breakout strategy
The HMA breakout strategy focuses on identifying and trading breakouts from established support or resistance levels, which may signal the beginning of a strong trend.
The first step is to identify significant support and resistance levels on the price chart. These levels typically form when the price reaches a high or low point several times, creating a horizontal barrier. The HMA can then be applied to help determine the overall trend direction and gauge the strength of the breakout.
A breakout occurs when the price moves beyond the established support or resistance level, confirmed by the HMA. For instance, if the price breaks above resistance and the HMA also moves above it, it may signal a bullish breakout. If the price breaks below support and the HMA follows, it may suggest a bearish breakout. To increase reliability, traders can use additional indicators, such as Bollinger Bands® or the average true range (ATR).
Why choose HMA?
- Responsiveness and reduced lag: the HMA is designed to respond quickly to price changes, so signals appear earlier than with traditional averages, which may help traders identify potential trend shifts and reversals.
- Smoothness: despite its responsiveness, the HMA keeps a smooth curve with less noise than very short EMAs, which could help minimise false signals.
- Versatility: it can be applied to various timeframes, markets and trading styles.
Risks associated with HMA
- Lagging nature: although more responsive than traditional moving averages, the HMA is still a lagging indicator based on historical price data, which does not guarantee future returns.
- False signals: while its smoothness helps reduce noise, the HMA can still generate false signals, for example in choppy or range-bound markets.
- Parameter selection: choosing the right period can be challenging, as different market conditions and trading styles may require different settings.
Conclusion
The HMA is a valuable technical analysis tool that gives traders a responsive and smooth indicator for analysing price action. Developed by Australian stock market trader Alan Hull, it aims to address the lag and noise associated with traditional moving averages such as the SMA, WMA and EMA.
Choosing the appropriate parameters and timeframes is crucial, and traders are encouraged to experiment with different settings to find the best fit for their trading style. Alan Hull recommends a default period of 16, but other lengths can be explored as well. The HMA can be used for trend identification, trend reversals, support and resistance, and in combination with other indicators – two popular approaches being the crossover and breakout strategies.
Traders should also be aware of the risks: as a lagging indicator, it relies on historical price data that cannot guarantee future returns, it can generate false signals in choppy or range-bound markets, and selecting the right parameters can be challenging.
What is the Arnaud Legoux moving average (ALMA)?
The ALMA trading strategy is an approach built on the Arnaud Legoux moving average (ALMA), a technical analysis indicator that calculates the average price of an asset over a specific period using a Gaussian distribution function. Created by the French mathematicians Arnaud Legoux and Dimitris Kouzis-Loukas in 2009, it aims to provide a responsive and smooth moving average while reducing lag and noise.
Highlights
- ALMA is a technical analysis indicator designed to provide a responsive and smooth moving average while reducing lag and noise.
- Created by Arnaud Legoux and Dimitris Kouzis-Loukas, it uses a Gaussian distribution function to assign weights to the data points within the specified period.
- ALMA can be used for trend identification, trend reversals and dynamic support and resistance, and combined with other indicators to enhance trading strategies.
- Combining ALMA with two EMAs is a popular ALMA trading strategy, but there are more ways of using the indicator.
- ALMA offers smoothness, filtering capabilities and reduced lag, but traders should be aware of risks such as false signals, complex calculations and the importance of using it with other indicators.
Calculating ALMA
Although the ALMA indicator is available on most charting and trading platforms, understanding the calculation behind it can help traders use it effectively. The ALMA formula is based on a weighted sum using a specified time period and a Gaussian filter offset, with the weights determined by a Gaussian distribution function. The average is applied in a way that minimises the lag often associated with traditional moving averages.
In short, the default ALMA formula is: ALMA = (weighted sum of prices) / (sum of weights), where:
- Weighted sum of prices: each price within the selected period is multiplied by a specific weight, determined using a Gaussian function that assigns higher weights to more recent prices and lower weights to older ones. This makes the ALMA focus more on recent price data and respond faster to price changes.
- Sum of weights: the sum of all the weights assigned to the prices in the period. Dividing by it normalises the ALMA, so the final result is not skewed by the weighting process.
Indicator settings
When setting up ALMA parameters, consider your trading strategy and time horizon. The indicator has three key components – window size, offset and sigma – which can be named differently on various platforms; on some, for example, they are called period, shift and deviation.
Note that the standard deviation is not directly involved in the ALMA calculation; however, one of the indicator's parameters, sigma, refers to the deviation used in the Gaussian distribution function.
- Period or window size: also known as the length or look-back period, it determines how many historical data points are used in the calculation. A shorter window makes the ALMA more responsive to recent price changes but may increase noise and false signals; a longer window makes the line smoother, with less noise, but slower to react.
- Shift or offset: determines the position of the Gaussian filter used to weight the data points. It is expressed as a fraction of the window size, between 0 and 1. A higher offset shifts the filter towards the most recent data, making the ALMA more responsive but potentially noisier; a lower offset shifts it towards the centre of the window, giving a smoother line but potentially more lag.
- Deviation or sigma: the standard deviation used in the Gaussian distribution function. It determines the smoothness of the curve and how much more heavily data points near the centre of the window are weighted. A smaller sigma gives a narrower filter and a more responsive ALMA, with a higher chance of noise and false signals; a larger sigma gives a wider filter and a smoother line, but with more lag.
Traders can experiment with various window sizes to find the right balance between responsiveness and noise reduction, and test their settings on a demo account to examine the signals. Always conduct your own due diligence before trading, and never trade more money than you can afford to lose.
How to use the ALMA indicator in trading
There are several ways to use the indicator – for trend analysis, for example, or paired with other technical analysis tools for a fuller picture.
Trend identification
The ALMA can help identify the direction of the price trend. When the lowest point of each candlestick is below the ALMA line, it suggests a potential bearish trend; if the lowest point is above the ALMA line, it indicates a possible bullish trend. The wider the distance between the candlesticks and the ALMA line, the stronger the trend, while a narrowing gap could signal a potential reversal.
Trend reversal
When the ALMA line begins to change direction relative to the price, it can give early warning of a potential trend reversal. For instance, if the price moves from consistently trading above the ALMA line (a bullish trend) to crossing below it, it could signal a shift towards a bearish trend. Similarly, if the price moves from consistently trading below the ALMA line to crossing above it, it may suggest a shift towards a bullish trend – the ALMA line repositions from below to above the price, or vice versa.
Support and resistance
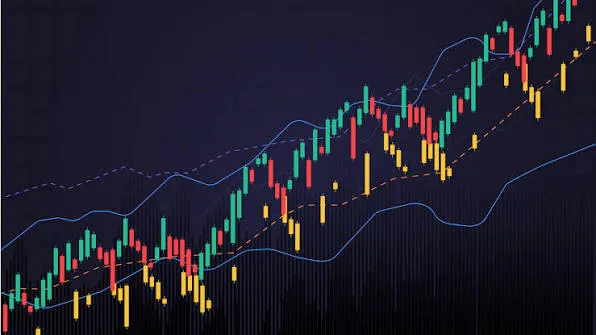
The ALMA can also serve as dynamic support and resistance, as it adapts to changing price action. When the price is above the ALMA line, the line may act as support, suggesting the price could bounce off it and move higher. When the price is below the ALMA line, it could act as resistance, indicating the price might face downward pressure and reverse lower.
Traders who follow this approach may consider a long position when the price approaches the ALMA line from above, treating it as potential support, and a short position when the price approaches it from below, treating it as potential resistance.
Combining with other indicators
The ALMA can be combined with other moving averages with different calculation methods and timeframes to potentially improve the quality of signals. It can also be used with indicators such as the relative strength index (RSI), the parabolic stop and reverse (SAR) and Bollinger Bands® to confirm a trend and determine its strength.
ALMA and EMAs trading strategy
This strategy combines the smoothness and responsiveness of the ALMA with the more traditional EMA. To set it up, plot three moving averages on your chart: a long-period ALMA (for example, 100 days) and two short-term EMAs (for example, 10 and 15 days).
The ALMA serves as the primary trend filter, dictating whether long or short positions are taken depending on whether the price is above or below it, while the 10 and 15-day EMAs provide bullish or bearish crossover signals. For example, when the ALMA is below the price and the 10-day EMA crosses over the 15-day EMA, this can be considered a bullish signal. When the ALMA is above the price and the 15-day EMA crosses over the 10-day EMA, this can be considered a bearish signal.
Why choose ALMA?
- Smoothness: ALMA is designed to provide a smoother moving average line that could help reduce noise and false signals and identify actual trends.
- Filtering capabilities: it combines the benefits of weighted moving averages and Gaussian filters, offering an effective way to filter out excessive signals in indecisive markets.
- Reduced lag: its calculation method results in less lag than traditional moving averages, meaning faster reactions for traders.
Risks associated with ALMA
- False signals: while ALMA is designed to reduce false signals, it is not immune to them. Traders should use additional confirmation techniques.
- Complex calculation: its calculation method is more complex than that of standard moving averages, which might make it harder for some traders to understand and apply correctly.
- Not a standalone indicator: like any technical indicator, ALMA should not be used on its own to make trading decisions, but combined with other indicators and price action analysis.
Conclusion
ALMA provides a smooth and responsive moving average by using a Gaussian distribution function to weight the data points within a specified period. Its calculation method reduces lag and noise, setting it apart from other moving average types. Traders can use it for trend identification, trend reversals and dynamic support and resistance, and a common strategy combines the ALMA with two EMAs.
While ALMA offers smoothness, filtering capabilities and reduced lag, traders should be aware of potential risks, such as false signals and the need to combine it with other indicators and price action analysis. For traders who decide to use the ALMA strategy, understanding the calculation behind the indicator is key to decision-making.
What is MACD?
The moving average convergence divergence (MACD) is a momentum indicator that shows the relationship between two EMAs, typically the 12- and 26-period. The MACD line is the difference between them, and a 9-period EMA of the MACD line is plotted as the signal line.
MACD = integrated use of trend, price and momentum
Crossovers of the MACD and signal lines, moves above or below zero, and divergence between MACD and price are all used as trading signals.
What is ADX?
The average directional index (ADX) measures the strength of a trend, regardless of its direction. It's plotted alongside the positive (+DI) and negative (−DI) directional indicators.
How to use the ADX indicator in trading
Trend identification
An ADX reading above 25 generally indicates a strong trend, while a reading below 20 suggests a weak or ranging market.
Trend reversal
A falling ADX after a strong trend can signal that the trend is losing momentum and may reverse.
Support and resistance
Combining ADX with support and resistance levels can help confirm whether a breakout is likely to hold.
Combine with other indicators
ADX shows trend strength but not direction, so it's commonly paired with moving averages or the directional indicators to decide whether to go long or short.
Why choose ADX?
- Objective trend strength: helps decide which strategy suits current conditions.
- Filters weak setups: avoid trend strategies in ranging markets.
- Works across markets: applicable to forex, indices, commodities and stocks.
Conclusion
Technical indicators help traders interpret price action, but none are infallible. Combining several tools with a clear plan and disciplined risk management gives the best chance of consistent results.